This brief tutorial describes how to process spectral images from a slit spectroscope to
AstroArtV5 was used for image acquisition and basic pre-processing. If you use a
different software, it will have similar capabilities, you need to check the manual.
Appendix C: Processing spectral images in BASS Project
obtain a fully calibrated, normalised profile.
Preamble
The usual focusing of the imaging camera to the reference lamp (to give minimum
FWHM) and the target star focused on the slit gap -to give minimum spectral height
apply.
the spectrum sits exactly across the horizontal axis of the CCD chip.
Take some time to remove any "tilt" - subsequent processing is MUCH easier when
horizontally before opening in BASS Project.
the blue region must be at the left hand side. The image, if necessary, can be flipped
the target star should stay well on the slit gap.
gives the potential of better guiding. PHD (and AA5) can guide at sub-pixel levels so
If the length of the slit is orientated either along the RA or Dec (Dec axis preferred) it
Understand and note the orientation of the spectrum image. For subsequent processing
The choice of slit gap width will be dictated by your telescope focal length, seeing
and guiding accuracy.
on the slit gap for the duration of the exposure sequence. The optimum exposure of
To achieve best SNR the guiding software should be capable of holding the target star
the subs will be determined by your target brightness, telescope aperture, camera QE
bright sky solar spectrum and the prominent Balmer/ Mg/ Na/ telluric lines.
settings makes things much easier. A good calibration can be easily done using a
Having a calibration curve of the grating rotation/ wavelength using the micrometer
conditions, and resolution required.
Sequence
Darks - based on the target camera temperature (i.e. -10deg) and the "optimum" sub
Bias and flats - for this introductory tutorial these will be ignored.
exposure (in this case 120sec). A set of ten darks were stored in the folder. You may
- Set up a storage folder by date/object.
needs an 8sec exposure with the Neon and a 20 sec exposure for the Argon lamp.)
need to take a series, minimum 9 exposures, to suit your set-up.
- Take an exposure of the reference lamp before (and after) the target star. (Usually
slit gap - confirm guiding is OK
close to the centre height of the CCD chip. You may need to take a longer exposure if
- Take a 10sec - 30 sec trial exposure to confirm the spectral image is horizontal and
- Set the target star image onto the centre of the slit height and position it into/onto the
you need to accurately determine/ confirm the central wavelength.
- Take an exposure of the reference lamp.
- Commence the sequence of exposures.
Example
Based on the recent Nova Cen results. Over the period various gratings (300/1200/600
l/mm) were used. The equipment used was a Genesis 4" f5 with the Spectra-L200,
Depending on the data requirements you want to record, use the micrometer head to
pre-set the central wavelength to the required target wavelength. i.e. Ha
mounted on a NEQ6pro mount. The mount is controlled through Carte du Ceil (CdC)
for guiding and AstroArtV5 for acquisition.
and EQmod. Lodestar guide camera and ATik 314L for imaging. PHD V2.2 (or AA5)
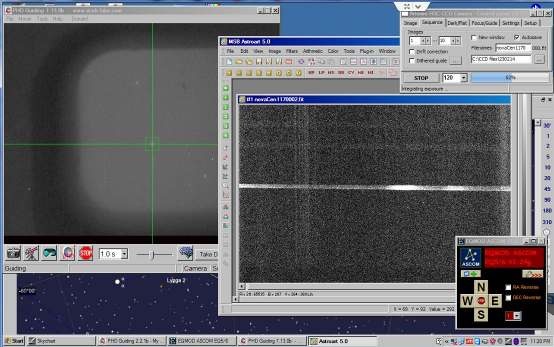
This shows a typical run set-up - the guide image is at the left hand side with the
target star "locked" in the guide software. The image of the spectrum being recorded
is in the AA5 screen. A sequence has been set to give 10 x 120 sec exposures.
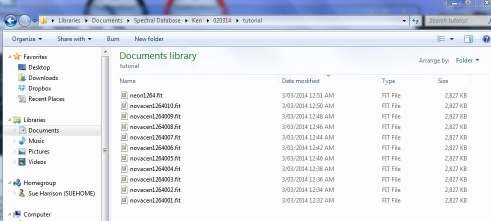
The reference lamp and target images are stored here. The micro settings were used to
distinguish different regions when doing multiple exposures. i.e. 1264 for Ha, 1360
for Na, 1390 for Hb etc.
AstroartV5 in the Processing tab allows all the darks and lights to be selected, and
stacked. I prefer to stack the darks as "Median stacking" and the target as "Average"
If hot pixels are evident apply a hot pixel filter to suppress them.
c for cropped)
The file can be saved as "novaCen1264_d_c.fit" (The suffix d for dark corrected and
The stacked spectral image is inspected to find the central Y value The image is then
cropped about 80 pixel high - i.e. Y1 = 540, Y2=460 (based on a centre of 500)
exactly the same as the spectrum (Important when applying slant/ smile corrections)
as "Neon1264_c.fit". This ensures that the centre of the reference lamp image is
A cropped, dark corrected stacked exposure of your target spectrum.
Using exactly the same crop settings, open the reference lamp images and apply. Save
Open BASS and select the reference lamp image FIRST. This ensures that the
-
calibration of the subsequent spectra are linked to the reference spectrum.
-
At least one cropped reference lamp spectrum.
These images are then opened in BASS Project for calibration and processing.
At the end of the observing session you should have:
Summary
Open the target spectrum
BASS Project
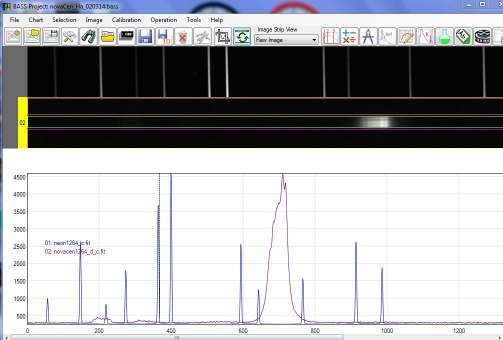
window. It automatically then produces a profile, based on the full height of each
BASS presents the imported images as a series of "Image Strips" at the top of the
Slant corrections
Any residual tilt can be corrected using the "Image"/ "tilt" drop down menu. Tick the
box to apply the corrections to all image strips.
Tilt Corrections
profile. The spectrum of the nova shows clearly the Ha emission.
image strip. You can see the reference lamp peaks superimposed on the raw target
It's much better to correct any tilt of the spectrum across the CCD by adjustment of
the imaging camera. This is the recommended method.
"Image"/ "slant" drop down menu. Tick the box to apply the corrections to all image
neon1264_c_tilt.fit as
strips.
You can correct for the inevitable slant found in Littrow spectroscopes using the
Save both images, this time indicating the correct that has been applied
neon1264_c_tilt_smile.fit
novacen1264_d_c_s_tilt.fit as
novacen1264_d_c_s_tilt_smile.fit
Once the binning zone is finalised, select an area above,("Set subtraction region1")
Click "Selection"/ "Set active binning region" Click and pan across the spectrum to
select the region. When set, you'll see the green strips top and bottom.
determine where the top and bottom edges lie.
Selecting the binning region and sky removal
Increasing the brightness (this doesn't change the underlying image) helps to
Make sure the target spectrum image strip is selected - it will display a yellow border.
background.
selected to encompass the full height of the spectrum without including excessive sky
To extract the optimum data from your spectrum the vertical binning zone should be
then below this zone ("Set subtraction region2") to extract the sky background and
any light pollution from the spectrum. You'll see these areas bounded by the pink
lines. Click the "Refresh" icon to apply the zones.
Calibration
It's easier to start with a print out of the lamp spectra, to give a wide overview of the
spectrum. Knowing the central wavelength setting and looking at the features in your
target spectrum (Ha, telluric etc.) will give some guidance. Obviously the number of
available lines will vary with the grating dispersion.
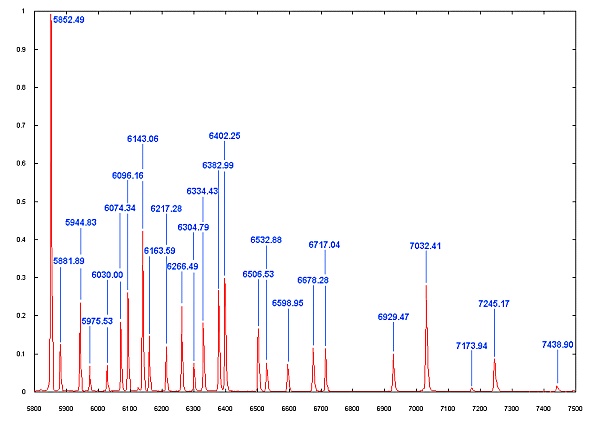
The Neon annotated graph (from Christian Buil's excellent website) will help you get
started.
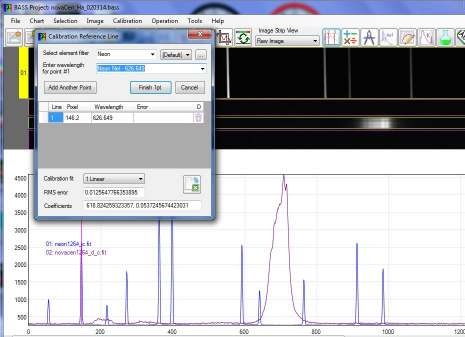
Make sure the #1 image strip (the reference lamp) is selected. Click the calibration
icon. The line selection box has the standard lines for both Neon and Argon lamps.
Starting from the left, click and drag the mouse over the emission peaks to select the
peak and enter the selected wavelength.
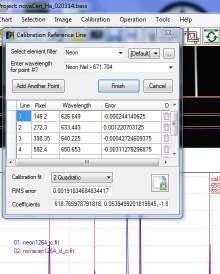
Do this for as many lines as required - the more the better. You can select a non-
entries as needed.
linear quadratic solution if you have enough lines. (Using non linear solutions will
If the wavelengths selected don't match the reference, the dotted calibration indicators
give a more accurate result and are the recommended method)
will be seen off-set to the actual emission lines. Check your selection and correct the
When calibration is complete press "finish' and the pixel scale on the main window
will now show the wavelengths in nm and the dispersion in nm/pixel.
The default BASS setting is a Linear calibration. You can see, based on the selected
lines, this gives a RMS error of 0.013nm. (0.13A)
Selecting a Quadratic calibration, for this example, gives an RMS of only 0.0019nm,
(0.019A) almost an x10 improvement.
the dispersion is displayed.
You'll probably find an reminder screen message!!.
make sense to you later.
It will ask you to save the "changed" image strips (caused by the application of the
Once calibration is complete, the X scale changes from pixel to wavelength (nm) and
Save the project by clicking the save icon. Give it a name and reference which will
tilt/slant correction). Right click on each image strip and select save. If you want to
retain the original image (recommended) give the corrected a new name (add _s to the
end? Slant corrected)
You can also remove the calibration lines. Un-click "Calibration"/"show calibration
points" and right click on the reference image strip and select "hide". This just leaves
Adding Title and Notes
Now save the project.
the calibrated target profile on the screen.
"hide". This just leaves the calibrated target profile on the screen.
If you haven't done it already, right click on the reference image strip and select
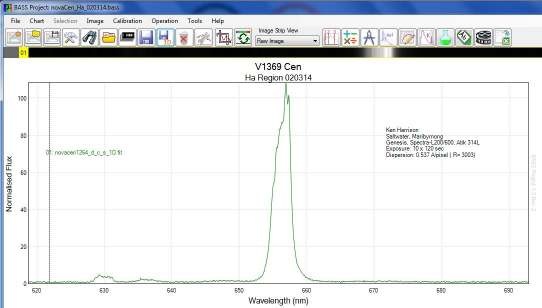
Click the "Chart"/ "Edit Project Chart Settings". On the first screen type in the Title
and Sub title as required.
Click the "Notes" tab, and type in any notes you'd like to record on the chart.
When finished click "Apply" & OK.
Determining Resolution and R value
resolution/ R value.
and select "Show notes here" to reposition the notes as required.
The title and sub title will now show on the chart. You can right click on the chart
I like to show the dispersion (0.537 A/pixel) in the notes. Also the calculated
The neon lines now show on the graph.
In the new screen you'll see the calculated FWHM of the selected line (0.22nm) and
results when run" and click run.
Unhide the reference lamp image strip and select it as the active strip (yellow border).
(667.4838 to 668.1553) will come up and the selected line turns red. Tick the "Show
tab select "FWHM". Select a suitable line on the reference profile - the range selected
Select the "Measurement and Element lines" icon. Under the "Measurement options"
the R value (3003)
Hide the reference lamp image strip.
Note, the legend "01: neon", "02: nova" etc. are applied by BASS. These can also be
relocated in a similar fashion as the notes.
To change the colour of the profile, right click on the image strip and select "profile
You can save a copy of the profile chart as a .png, jpeg or bmp by right clicking on
the chart and saving with your selected name.
Copying the final annotated Chart
Saving profile as a 1D fits file
properties". The tab "Display" allows you to select your colour of choice.
Save the project.
profile will now also be displayed on the graph.
The profile can be saved as a fits file by clicking the "1D" icon and saving. The fits
Normalising the profile
then "Close".
any rescaling of the Y axis). Close the reference and original spectrum profiles, (right
click on the image strip and select "remove image") just leaving the 1D profile on the
to use. Any reasonable "flat" section of the continuum can be used. Click "Apply"
Normalising works best for me on a 1D profile. (You don't have to get involved in
chart. Click "Image/"normalise flux scale" and enter the wavelength interval you want
You can save this profile chart (with Name and Notes) by saving the project with a
new name, or save just the normalised profile as a 1D fits.
